How To Graph Trigonometric Functions | Trigonometry
How To Graph Trigonometric Functions | Trigonometry - Notes
1. Summary
This video tutorial explains how to graph sine and cosine functions, including transformations (horizontal/phase shifts, vertical shifts), amplitude, and period. It covers the basic shapes of sine and cosine waves, the effect of negative signs, how to determine amplitude and period from equations, and how to apply transformations to graph the functions. The video provides examples and practice problems to master the topic.
2. Key Takeaways
* **Basic Shapes:** Sine wave starts at the center (0) and Cosine starts at the top.
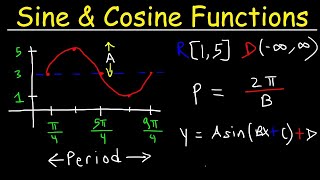
* **Amplitude:** The distance from the midline to the highest or lowest point of the wave. Determined by the coefficient 'a' in the generic form *a*sin(*bx* + *c*) + *d* or *a*cos(*bx* + *c*) + *d*.
* **Period:** The length of one complete cycle of the wave. Calculated as 2π / *b*, where *b* is the coefficient of *x*.
* **Phase Shift:** Horizontal shift of the graph, determined by -*c*/ *b*. A positive *c* causes a shift to the *left*, a negative *c* causes a shift to the *right*.
* **Vertical Shift:** Vertical movement of the graph, determined by *d*. Positive *d* shifts the graph upwards, negative *d* shifts the graph downwards.
* **Negative Sign:** A negative sign in front of the sine or cosine function reflects the graph over the x-axis.
* **Domain and Range:** Domain for sine and cosine is all real numbers. The range is determined by the amplitude and vertical shift.
3. Detailed Notes
**3.1. Introduction to Graphing Trigonometric Functions**
* Focus on graphing sine and cosine functions initially.
* Understanding the shape of the sine wave (sin x) and the cosine wave (cos x) is crucial.
**3.2. Basic Sine and Cosine Waves**
* **Sine Wave (sin x):** Starts at the origin (0,0), increases to a peak, crosses the x-axis, decreases to a trough, and returns to the x-axis, completing one cycle (period). One cycle ends at 2π.
* The wave continues infinitely in both directions (left and right).
* **Negative Sine Wave (-sin x):** Reflected across the x-axis. Starts from the origin, goes down initially.
* **Cosine Wave (cos x):** Starts at its peak (0,1) and crosses the x-axis, reaches a trough, and completes one cycle (period). One cycle ends at 2π.
* The wave continues infinitely in both directions (left and right).
* **Negative Cosine Wave (-cos x):** Reflected across the x-axis. Starts at its trough (0, -1).
**3.3. Key Points for Graphing and Breaking Down a Cycle**
* To accurately graph sine and cosine, break down each cycle into 4 intervals (5 key points) for a full period.
* Key points for one period (2π) of sine: 0, π/2, π, 3π/2, 2π
* Key points for one period (2π) of cosine: 0, π/2, π, 3π/2, 2π
**3.4. Amplitude**
* **Definition:** The distance from the midline of the wave to its highest or lowest point.
* **Generic Formula:** *a* sin(*bx* + *c*) + *d* or *a* cos(*bx* + *c*) + *d*
* **'a' value:** Determines the amplitude. The number in front of the sine or cosine function is the amplitude. The amplitude is always a positive value (absolute value of 'a').
* **Effect:** Stretches or compresses the graph vertically.
* *Example:* y = 2sin(x) has an amplitude of 2 (varies from -2 to 2). y = -3cos(x) has an amplitude of 3.
**3.5. Period**
* **Definition:** The length of one complete cycle of the wave.
* **Formula:** Period = 2π / *b*, where *b* is the coefficient of *x*.
* **Effect of 'b':** Changes the horizontal compression or stretch of the graph.
* *Example:* For sin(2x), b = 2, so the period is π (the graph is horizontally compressed).
**3.6. Transformations: Vertical Shifts**
* **Generic Form:** *a*sin(*bx* + *c*) + *d* or *a*cos(*bx* + *c*) + *d*
* **'d' value:** Represents a vertical shift.
* *Positive d:* Shifts the graph *up*.
* *Negative d:* Shifts the graph *down*.
* **Graphing with a Vertical Shift:**
1. Plot the new *midline* (horizontal line) at y = *d*.
2. Use the amplitude to determine the highest and lowest points relative to the midline.
3. Plot the key points for the sine or cosine function based on the period, using the midline as the center.
**3.7. Transformations: Phase Shifts (Horizontal Shifts)**
* **Generic Form:** *a*sin(*bx* + *c*) + *d* or *a*cos(*bx* + *c*) + *d*
* **'c' value:** Represents a phase shift (horizontal shift).
* **Finding the Phase Shift:** Set the expression inside the sine or cosine function (*bx* + *c*) equal to zero and solve for *x*: *x* = -*c* / *b*.
* *Positive c:* Shifts the graph to the *left*.
* *Negative c:* Shifts the graph to the *right*.
* **Graphing with a Phase Shift:**
1. Determine the period (2π / *b*) and Amplitude.
2. Calculate the phase shift: -*c*/ *b*.
3. Use this value as the new starting point of the sine/cosine wave.
4. Find key points by adding the period and plotting accordingly.
Related Summaries
![[캡컷PC]0015-복합클립만들기분리된영상 하나로 만들기](https://img.youtube.com/vi/qtUfil0xjCs/mqdefault.jpg)

Why this video matters
This video provides valuable insights into the topic. Our AI summary attempts to capture the core message, but for the full nuance and context, we highly recommend watching the original video from the creator.
Disclaimer: This content is an AI-generated summary of a public YouTube video. The views and opinions expressed in the original video belong to the content creator. YouTube Note is not affiliated with the video creator or YouTube.