Section0201Video1
Video Notes: Section0201Video1
**Channel:** Kimberley Polly
**Summary:** This video introduces Chapter 2 of a course focused on graphical descriptions of data. It reviews key concepts from Chapter 1 (population, sample) and explains the goals of Chapter 2: summarizing data using tables and graphs, and interpreting data characteristics such as center, variation, distribution, and outliers. The video emphasizes the use of technology (specifically StatCrunch) for creating graphs and the importance of understanding how to interpret them.
**Key Takeaways:**
* Chapter 2 focuses on graphical descriptions of data: summarizing and interpreting data with tables and graphs.
* Review of Chapter 1 concepts: population (entire group of interest) and sample (subgroup data is collected from).
* Main goal: Use graphs to understand and describe data characteristics.
* Four main data characteristics explored: center (average), variation, distribution (shape), outliers.
* Focus on interpreting graphs, not necessarily creating them manually (though understanding the basics is important).
* StatCrunch will be used for creating graphs.
**Detailed Notes:**
1. **Introduction to Chapter 2:**
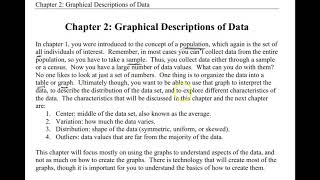
* Chapter 2: Graphical Description of Data.
* Focus: Summarizing data with tables and graphs.
* Goal: Interpret the data using graphs.
2. **Review of Chapter 1 Concepts:**
* Population: The entire group of interest.
* Sample: The subgroup of the population from which data is collected.
* Data collection: Samples are often used because it is difficult to collect data from the entire population.
* Data can be collected using a sample or a census.
3. **Organizing and Summarizing Data:**
* Problem: A large number of data values is hard to understand.
* Solution: Organize the data into tables or graphs.
* Primary Focus of Chapter 2: Tables and graphs.
* Ultimately, the goal is to interpret the data.
4. **Data Interpretation and Characteristics:**
* Goal: Use graphs to describe the distribution of the data set and explore its characteristics.
* Four Characteristics to be discussed:
* Center: The middle of the data set (average).
* Variation: How much the data varies.
* Distribution: The shape of the data (e.g., symmetric, uniform, skewed).
* Outliers: Data values far from the majority of the data.
5. **Emphasis on Interpretation & Tools**
* The chapter will focus on how to use graphs to understand the data, not on how to create the graphs.
* Technology will be used to create most graphs.
* It is important to understand the basics of creating graphs.
* StatCrunch is used to make the graphs.
Related Summaries
![[캡컷PC]0015-복합클립만들기분리된영상 하나로 만들기](https://img.youtube.com/vi/qtUfil0xjCs/mqdefault.jpg)

Why this video matters
This video provides valuable insights into the topic. Our AI summary attempts to capture the core message, but for the full nuance and context, we highly recommend watching the original video from the creator.
Disclaimer: This content is an AI-generated summary of a public YouTube video. The views and opinions expressed in the original video belong to the content creator. YouTube Note is not affiliated with the video creator or YouTube.